
XAU/USD Strategy
XAU/USD Strategy
The Basis of The Strategy
The Gold US Dollar currency pair is the first non-forex pair that I am tradin live. As for my other strategies, this algorithmic trading strategy utilizes the Dark Venus Expert Advisor, which is a free trading strategy in Metatrader 4 and 5. The strategy operates specifically on the 1-hour timeframe, executing both long and short trades.
Positions are only opened when the 1h bar closes above the bollinger band, see figure 1. The settings for the Bollinger bands are period 53, standard deviation 2.4. Crucial to make this strategy work is the time filter. This strategy only performs in periods between the open of the European market and the US market. Unlike the other Dark Venus strategies I operate, this system does not size up when the conditions are met again.
Take profit and stop loss are determined at 400 and 1100 ticks respectively. The backtesting data proves that this should be an optimal profit/loss ratio for a relatively stable return over time.

Figure 1. Single trade is opened when both the price closes above the upper BB and the time filter conditions are met. In the figure, two trades are opened shortly after each other.
Backtesting Results and Statistics
Figure 2 is generated based on a 0.01 lot size, taking into account a starting capital of 10,000 USD. Over the entire 10 years, the automated trading strategy is performing quite consistent. There are periods of consecutive winners, and periods of consolidation where no real gains are made.
Table 1 presents the backtesting results observed over the past 10 years, providing a comprehensive overview of the strategy's performance. The strategy is characterized by a relatively high win rate, largely due to its approach of employing a smaller take profit while simultaneously utilizing a larger stop loss. The Sharpe ratio stands at a positive 5.19, which is the highest of all my trading strategies so far. For this strategy, you could argue that quality beats quantity as only a limited number of trades are opened (272), averaging at ~27 trades a year.
| Net P/L (EUR) | Trades Total | Win % | Sharpe Ratio | Max Drawdown (%) | Avg. Trade Duration (hh:mm) |
|---|---|---|---|---|---|
| 281 | 272 | 80.88% | 5.19 | 0.45% | 6:49 |
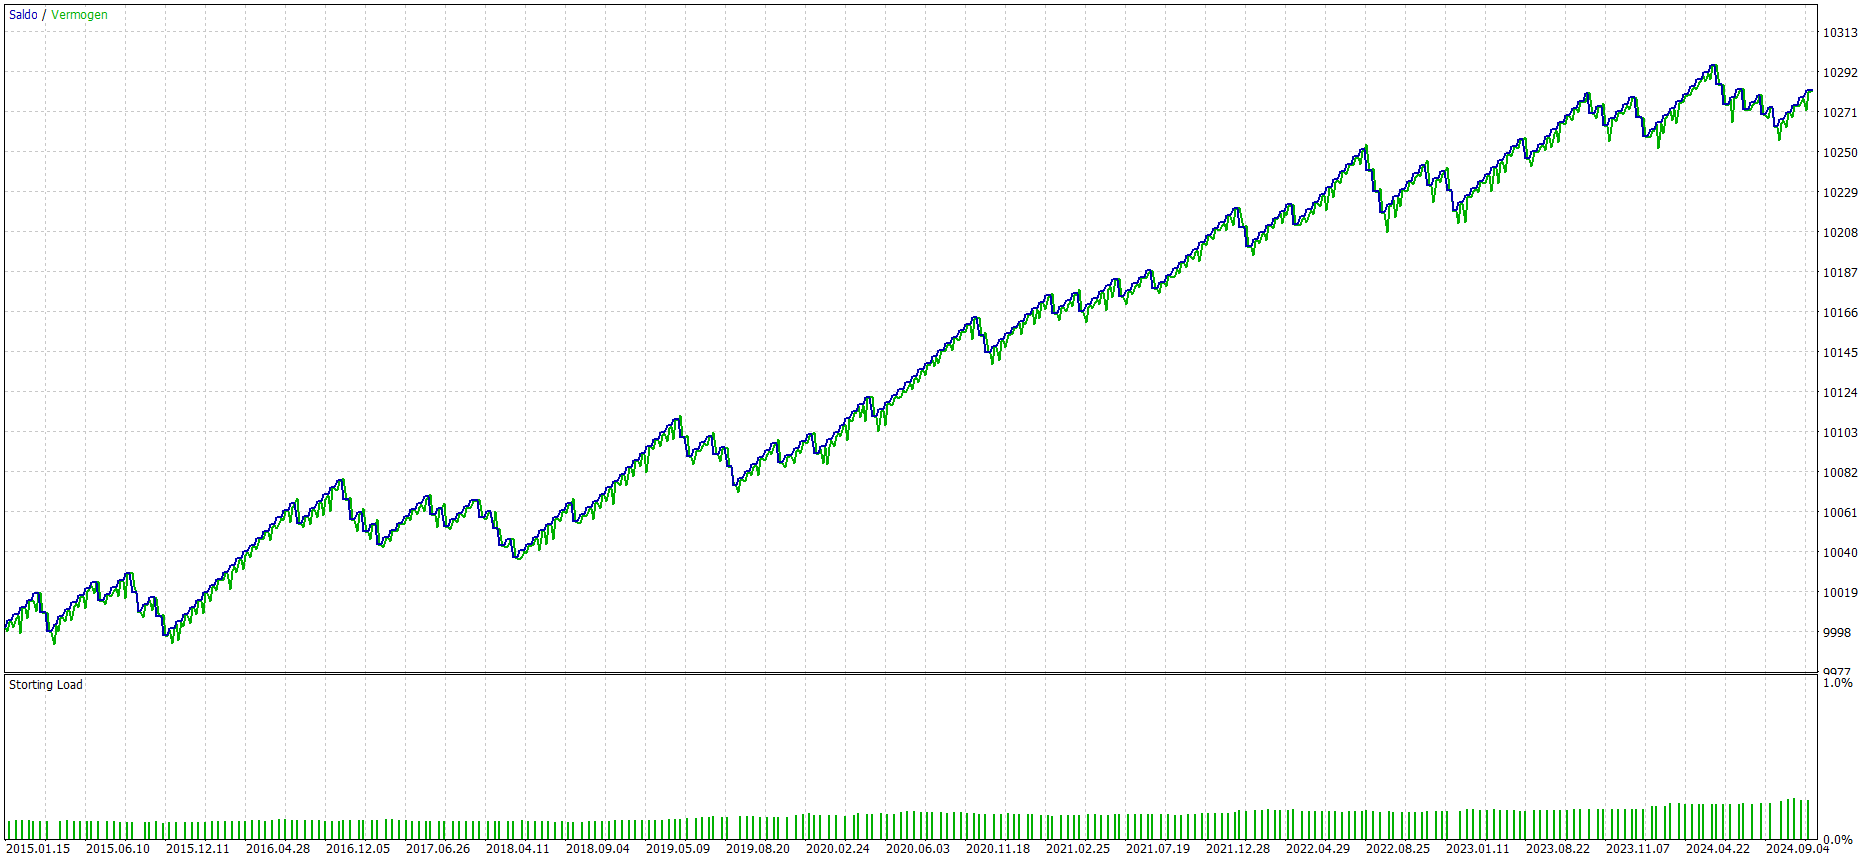
Figure 2. Equity curve and account margin plotted from 1/1/2015 to 1/1/2025
Long or Short only?
Notably, while writing this page, I noticed that my win rate for the long trades is significantly lower than the short trades, being 77% vs 81%. That raises the question if it would not be more beneficial to trade only in one direction. The backtesting results show that trading both directions is valid, as the long trades are also still profitable (Table 2). It must be concluded that the equity curve looks much worse (Figure 3) than for the short trades only (Figure 4). Interestingly enough, the short trades yield better results in a shorter time as the average trade duration is reduced by about 2h41m.
| Trade direction | Net P/L (EUR) | Trades Total | Win % | Sharpe Ratio | Max Drawdown (%) | Avg. Trade Duration (hh:mm) |
|---|---|---|---|---|---|---|
| Long | 77 | 134 | 77.61% | 2.69 | 0.49 | 8:00 |
| Short | 204 | 138 | 84.06% | 8.10 | 0.38 | 5.19 |
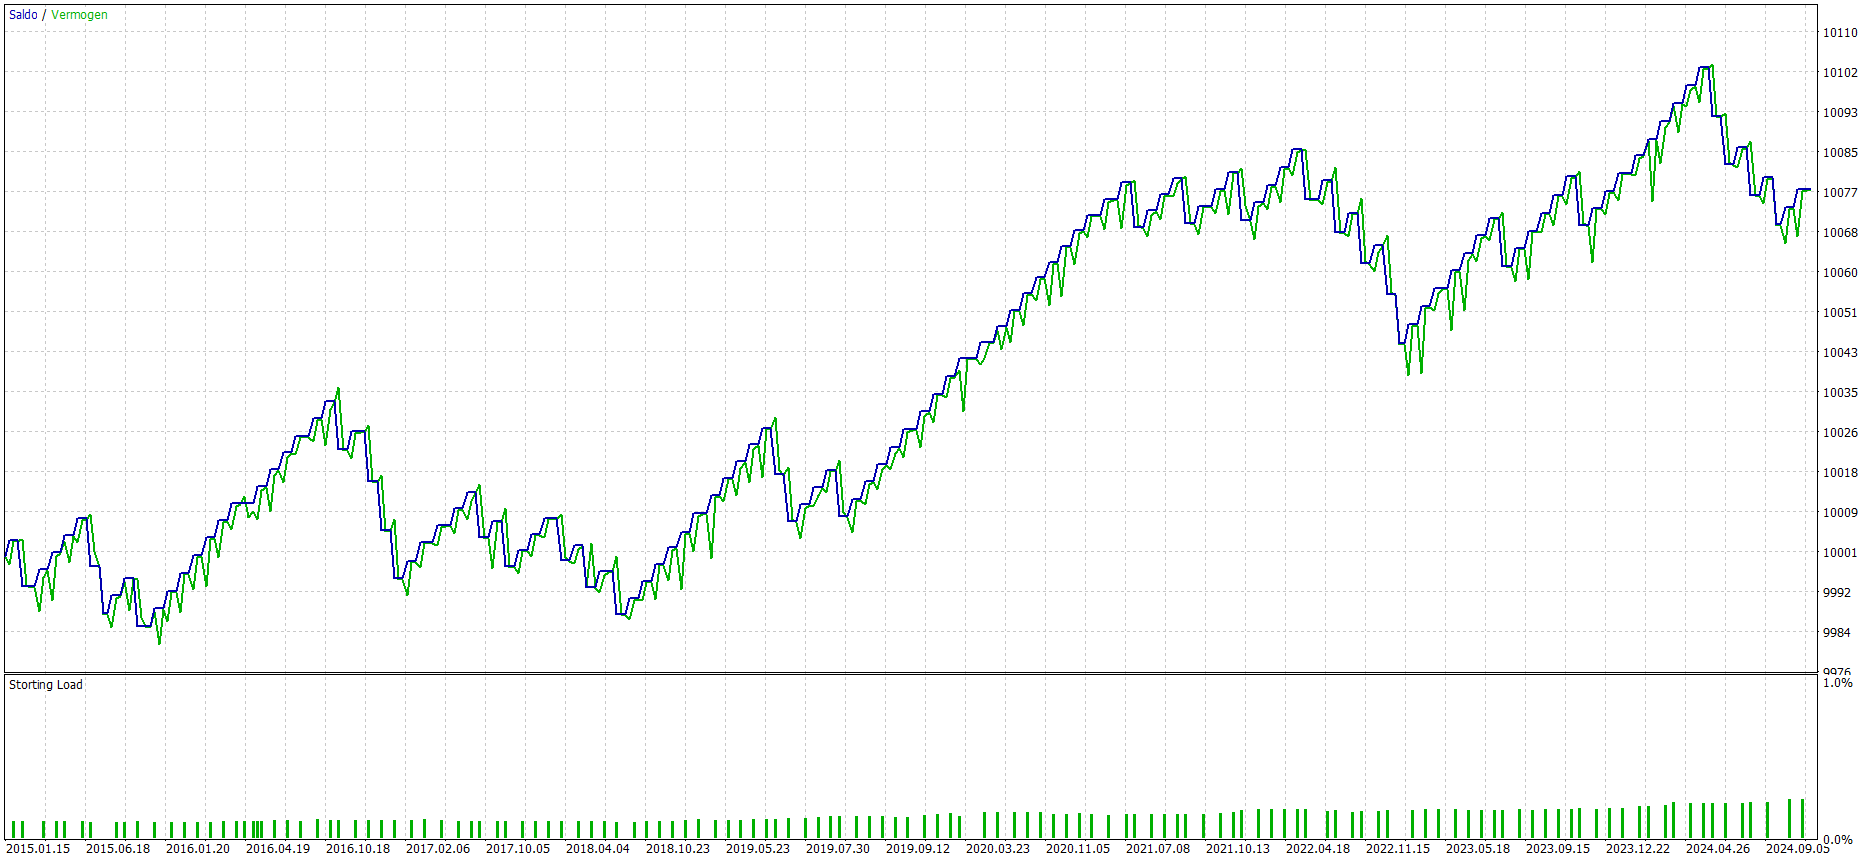
Figure 3. Equity curve and account margin plotted for long trades only from 1/1/2015 to 1/1/2025
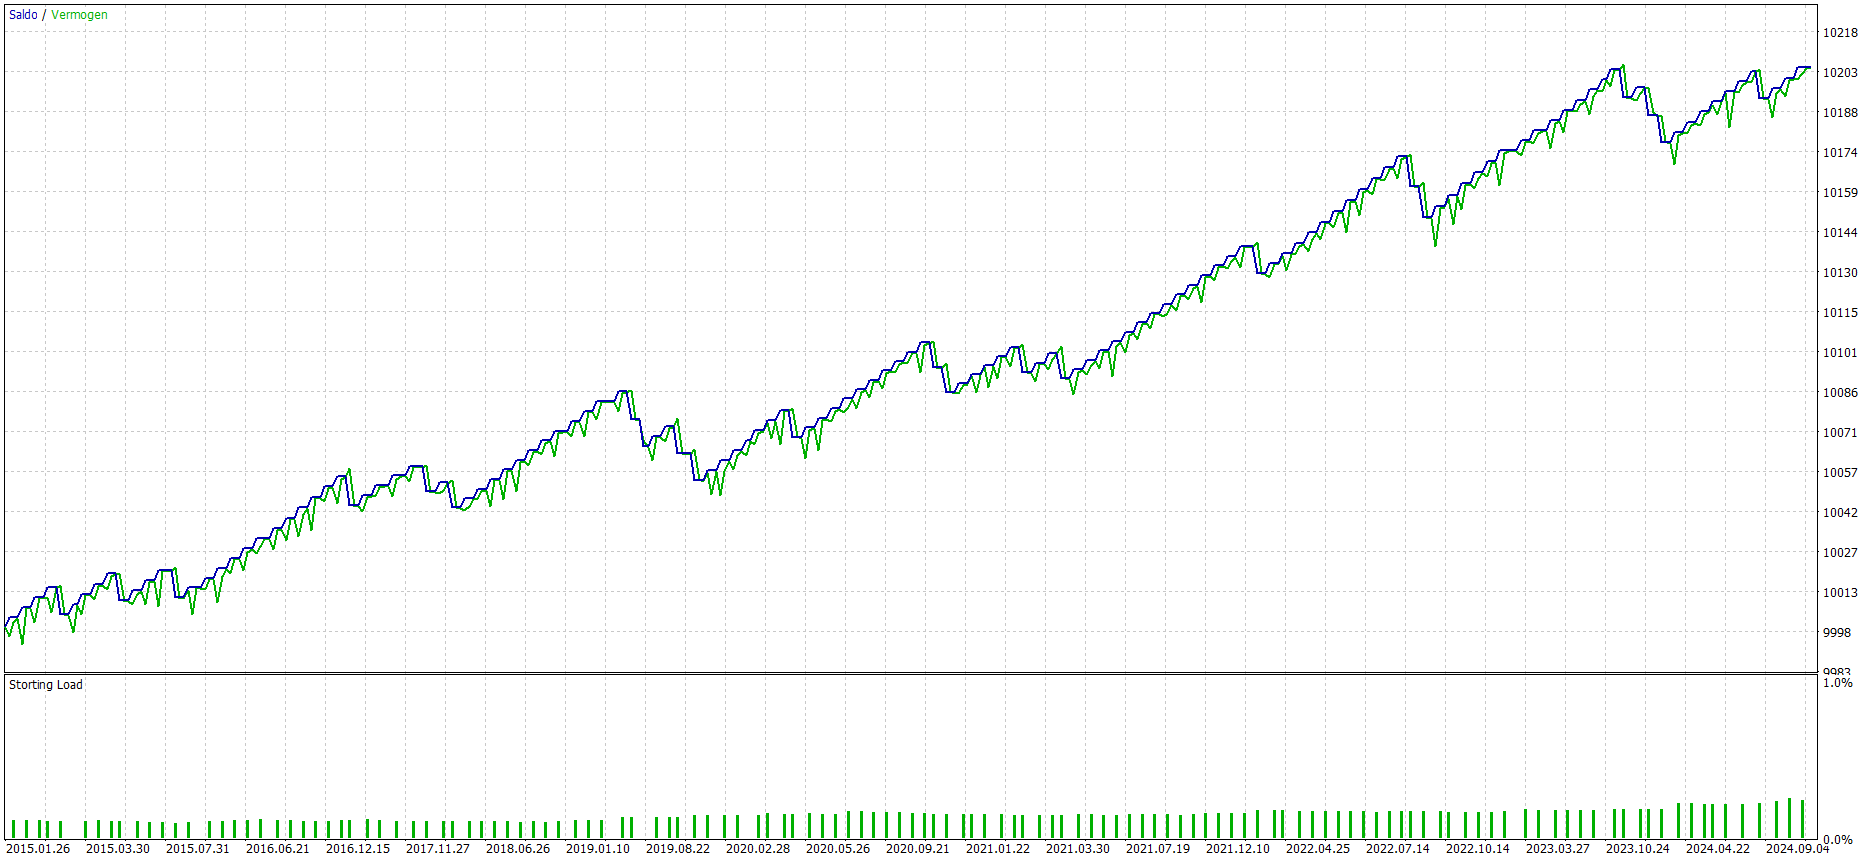
Figure 4. Equity curve and account margin plotted for short trades only from 1/1/2015 to 1/1/2025
Boosting The Return
Since I'll be running multiple algorithms simultaneously and I want to protect my account from large losses, I aim for a maximum drawdown of 20% over 10 year backtesting period. This should provide enough risk management that it will not blow up the account when running other strategies at the same time. For this strategy, I've set the risk percentage to 5% in the expert advisor (which does not match with the actual risk), enabling dynamic lot sizing over the backtest period. The results are shown in Figure 5.
The backtesting results in Table 4 show a compound annual growth rate (CAGR) of 13.93% and a maximum drawdown of 18.6%. Personally, this trade-off is better than investing in the stock market. Let’s find out of these backtesting results match with the actual performance!
| Net P/L (EUR) | Trades Total | Win % | Sharpe Ratio | Max Drawdown (%) | Avg. Trade Duration (hh:mm) | CAGR |
|---|---|---|---|---|---|---|
| 26855 | 272 | 80.88% | 4.76 | 18.6% | 6:39 | 13.93% |
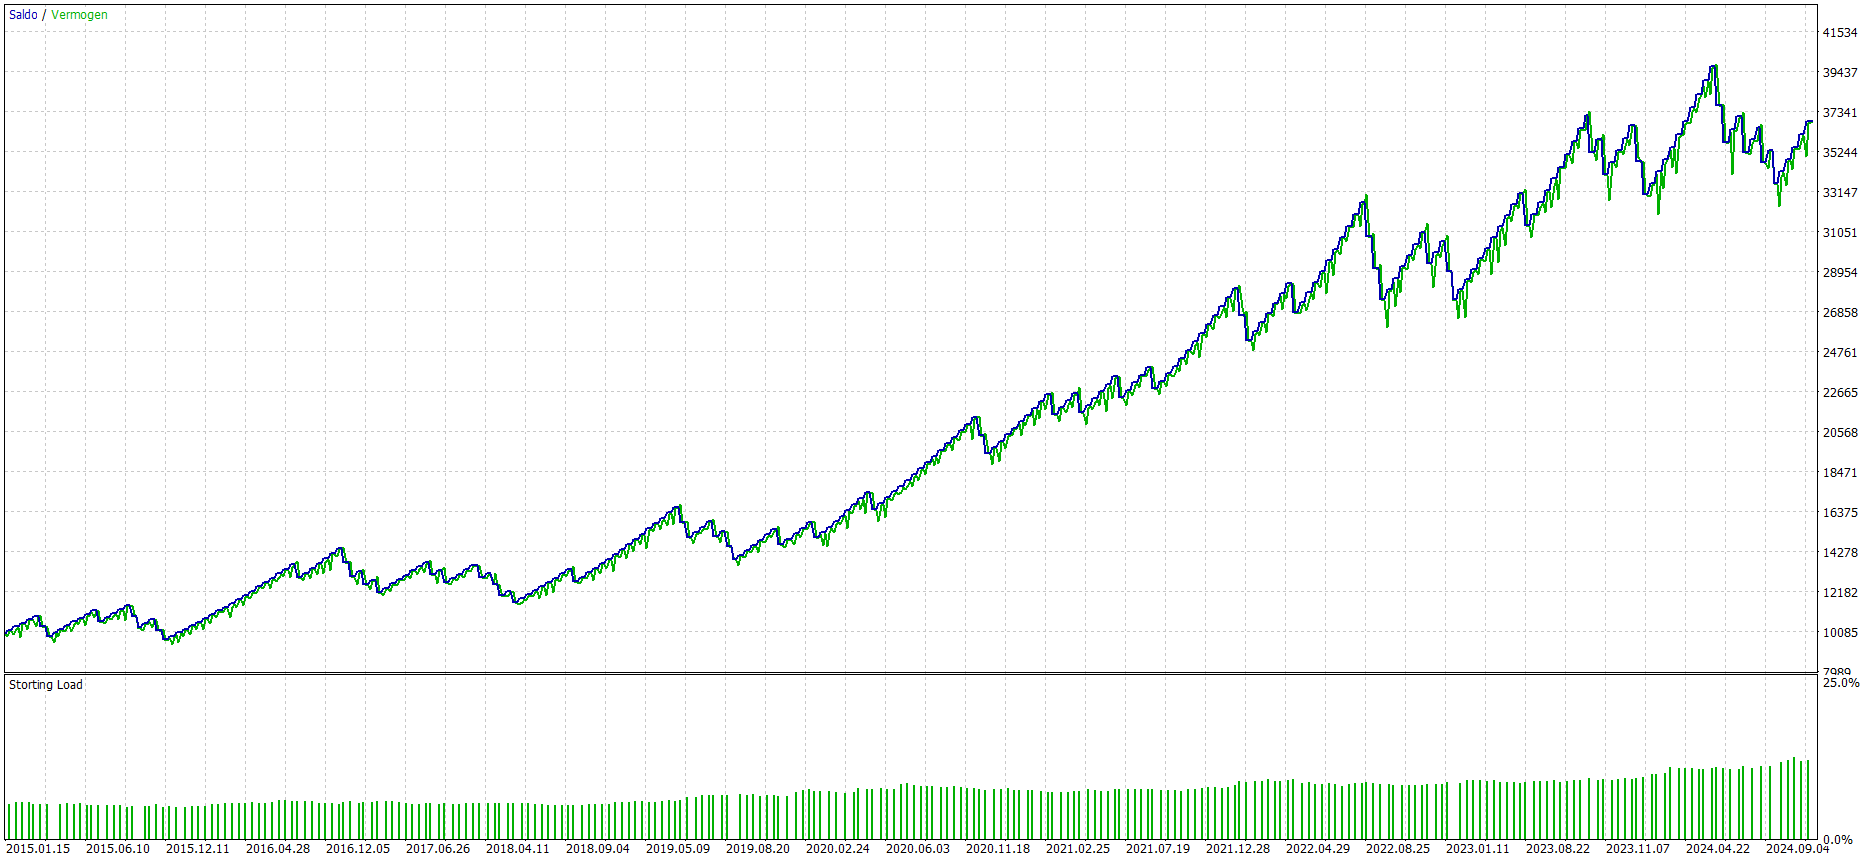
Figure 5. Equity curve and account margin plotted from 1/1/2015 to 1/1/2025 for the boosted results with a max drawdown of 18.6%.
Running the Strategy Live
Unlike common practice typically observed in algorithmic trading, I did not conduct a traditional out-of-sample test prior to implementing my trading strategy. Instead, I have backtested the strategy across a comprehensive time period of 10 years, during which it has consistently yielded a steady return each year, with an average of over 27 trades executed annually.
Given these favorable results, I made the decision to subsequently test the strategy using a small lot size of 0.01 over the course of the first 6 months, effectively acting as my out-of-sample test. After the conclusion of these 6 months, I will thoroughly review the performance metrics to ensure that the backtesting results align closely with the actual performance observed in the market, thereby allowing me to confirm that this strategy indeed possesses a tangible edge.
Interested to see how my automated trading systems are doing? Check out my blog by clicking the botton below!