
Step One: The Idea
Creating a successful trading strategy starts with formulating a solid and well-thought-out idea. For this particular experiment, I have chosen to focus on the double top and double bottom strategy, which is known for its effectiveness in various market conditions. Since my current algorithms primarily concentrate on scalping, incorporating a trend-following strategy will help diversify my overall portfolio and reduce risk. This specific type of strategy will typically be most effective when applied to trending currency pairs or tickers, thereby potentially enhancing my trading results.
Double Bottom/Top Pattern
The double top and double bottom are classic reversal patterns used in technical analysis:
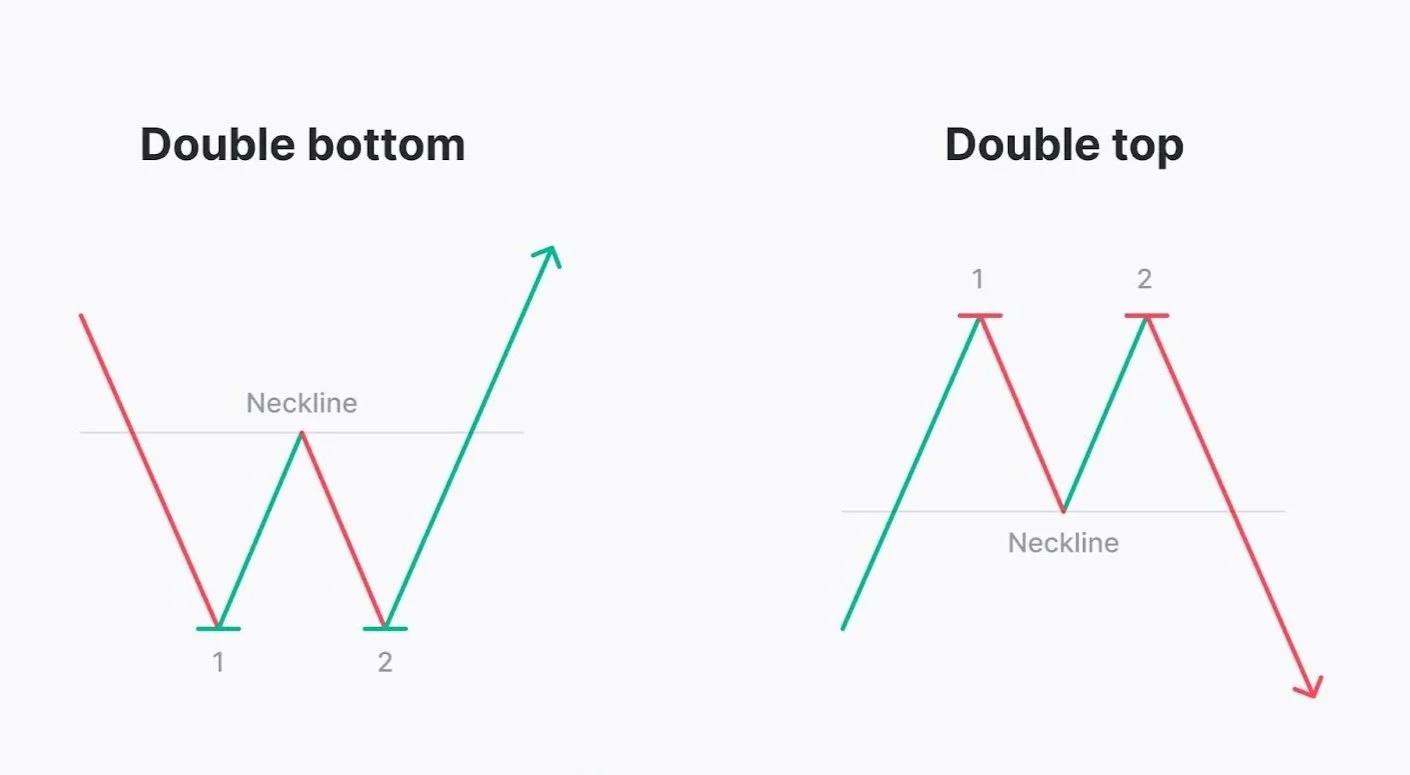
Double Top: This pattern forms after an uptrend. It is characterized by the price reaching a similar high twice, with a dip in between, creating an "M" shape. When the price breaks below the neckline—the support level connecting the dip—it signals that the previous uptrend may be ending, and a downtrend might begin.
Double Bottom: This pattern appears after a downtrend. It shows the price dropping to a similar low twice with a rebound in between, forming a "W" shape. When the price breaks above the neckline—the resistance level established between the two lows—it indicates a potential reversal from a downtrend to an uptrend.
Converting The Pattern To Entry And Exit Signal
The pattern appears to be quite obvious when observed with simple, straightforward lines, but it becomes substantially less clear and more complicated in the presence of noisy price charts. In order to make our algorithmic trading strategy as effective as possible, we need to establish clear, concise, and easily adjustable entry and exit signals that we can adapt to varying market conditions.
The Entry Signals
The pattern recognition relies on the pivot points of the Hull Moving Average (HMA). The HMA is a fast-acting indicator that provides smoother pattern detection.
The HMA pivot points will identify the lows and highs.
The Average True Range (ATR) will help check if the pivots are at the same level.
If multiple pivots are found at the same level, a trade is opened when the price passes the neckline.


The Exit Signals
The exit strategy uses the Donchian Channel, which shows the highest and lowest prices over a set time.
This trailing stop strategy lets trades last longer while reducing losses.
In a long trade, if the price falls below the lower Donchian Channel, the trade is closed. The same applies for short trades.
Using the Donchian channel exit strategy with an entry strategy often results in minor losses and significant profit potential. This method offers a balanced risk-reward scenario, where effective trade management can lead to favorable long-term returns.


Outlook
Now that the idea is clear, let's create a basic version of this trading strategy in TradingView to check its potential. TradingView is easy to use and great for visualizations, making it my preferred choice before advancing. Once we see that this strategy is promising, we can add more filters and further optimize it.