
EUR/USD Strategy
EUR/USD Strategy
The Basis of The Strategy
The EUR/USD 1h trading strategy was the first strategy that I traded on a live account. This algorithmic trading strategy utilizes the Dark Venus Expert Advisor, which is a free trading strategy in Metatrader 4 and 5. The strategy operates specifically on the 1-hour timeframe, executing both long and short trades.
Positions are only opened when the 1h bar closes above the bollinger band, see figure 1. The settings for the Bollinger bands are period 21, standard deviation 1.4. Crucial to make this strategy work is the time filter. This strategy only performs in periods of low volatility, which is before the american market opens. If entry conditions are met while a trade is still open, another larger short trade is opened, see figure 2.
Take profit and stop loss are determined at 50 and 2000 ticks respectively. While this might sound very counter-intuitive, the backtesting data proves that this should be an optimal profit/loss ratio. The drawdowns do need to be considered, which is further discussed in the next section!
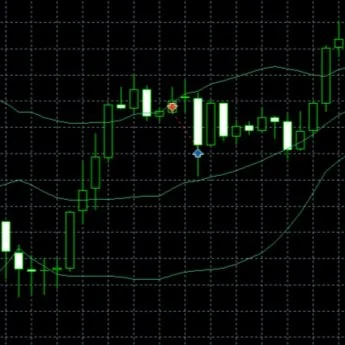
Figure 1. Single trade is opened when both the price closes above the upper BB and the time filter conditions are met.

Figure 2. Second trade is opened when the price again closes below the lower BB.
Backtesting Results and Statistics
Figure 3 is generated based on a 0.01 lot size, taking into account a starting capital of 10,000 USD. In the early years, from 2015 to 2017, the strategy is not performing well as there are no real gains. After 2017, the equity curve is relatively smooth, with periods of sharp drawdowns.
Table 1 presents the backtesting results observed over the past 10 years, providing a comprehensive overview of the strategy's performance. The strategy is characterized by a high win rate, largely due to its approach of employing a small take profit while simultaneously utilizing a large stop loss. While this methodology may appear unreasonable or counterintuitive to numerous traders, the extensive backtesting clearly demonstrates that it is effective. Notably, the Sharpe ratio stands at a positive 1.60, indicating a favorable risk-adjusted return, while the maximum drawdown remains low at just 0.82%.
| Net P/L (EUR) | Trades Total | Win % | Sharpe Ratio | Max Drawdown (%) | Avg. Trade Duration (hh:mm) |
|---|---|---|---|---|---|
| 317 | 2618 | 86.82% | 1.60 | 0.82% | 4:08 |
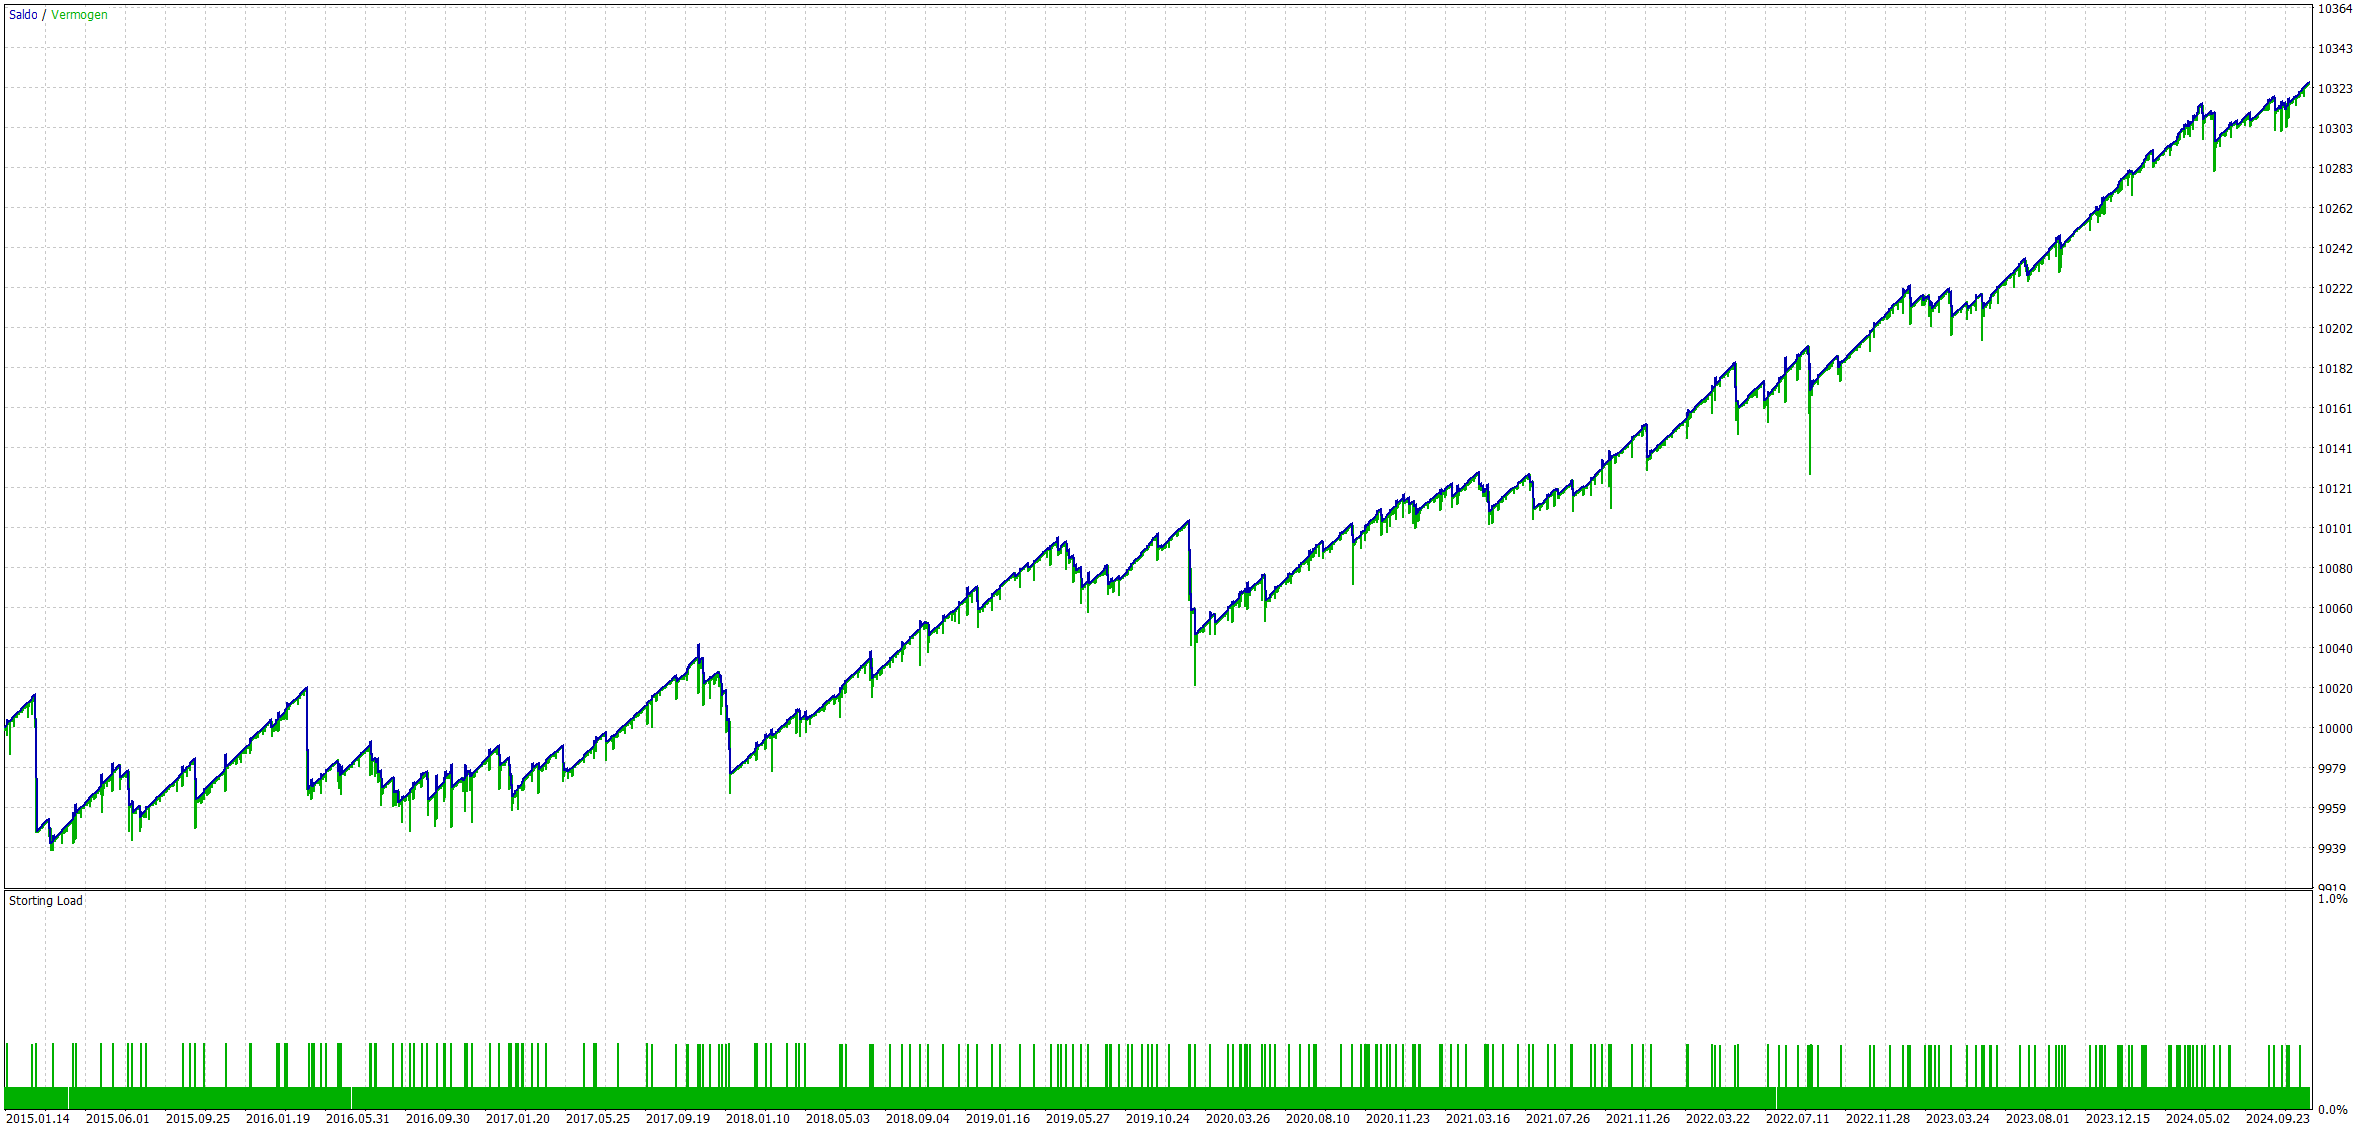
Figure 3. Equity curve and account margin plotted from 1/1/2015 to 1/1/2025
Boosting The Return
Since I'll be running multiple algorithms simultaneously and I want to protect my account from large losses, I aim for a maximum drawdown of 20% over 10 year backtesting period. This should provide enough risk management that it will not blow up the account when running other strategies at the same time. For this strategy, I've set the risk percentage to 3% in the expert advisor (which does not match with the actual risk), enabling dynamic lot sizing over the backtest period. The results are shown in Figure 4.
The backtesting results in Table 2 show a compound annual growth rate (CAGR) of 27.5% and a maximum drawdown of 19.2%. Personally, this trade-off is better than investing in the stock market. Let’s find out of these backtesting results match with the actual performance!
| Net P/L (EUR) | Trades Total | Win % | Sharpe Ratio | Max Drawdown (%) | Avg. Trade Duration (hh:mm) | CAGR |
|---|---|---|---|---|---|---|
| 18471 | 2618 | 86.82% | 1.42 | 21.87% | 4:08 | 11.1% |
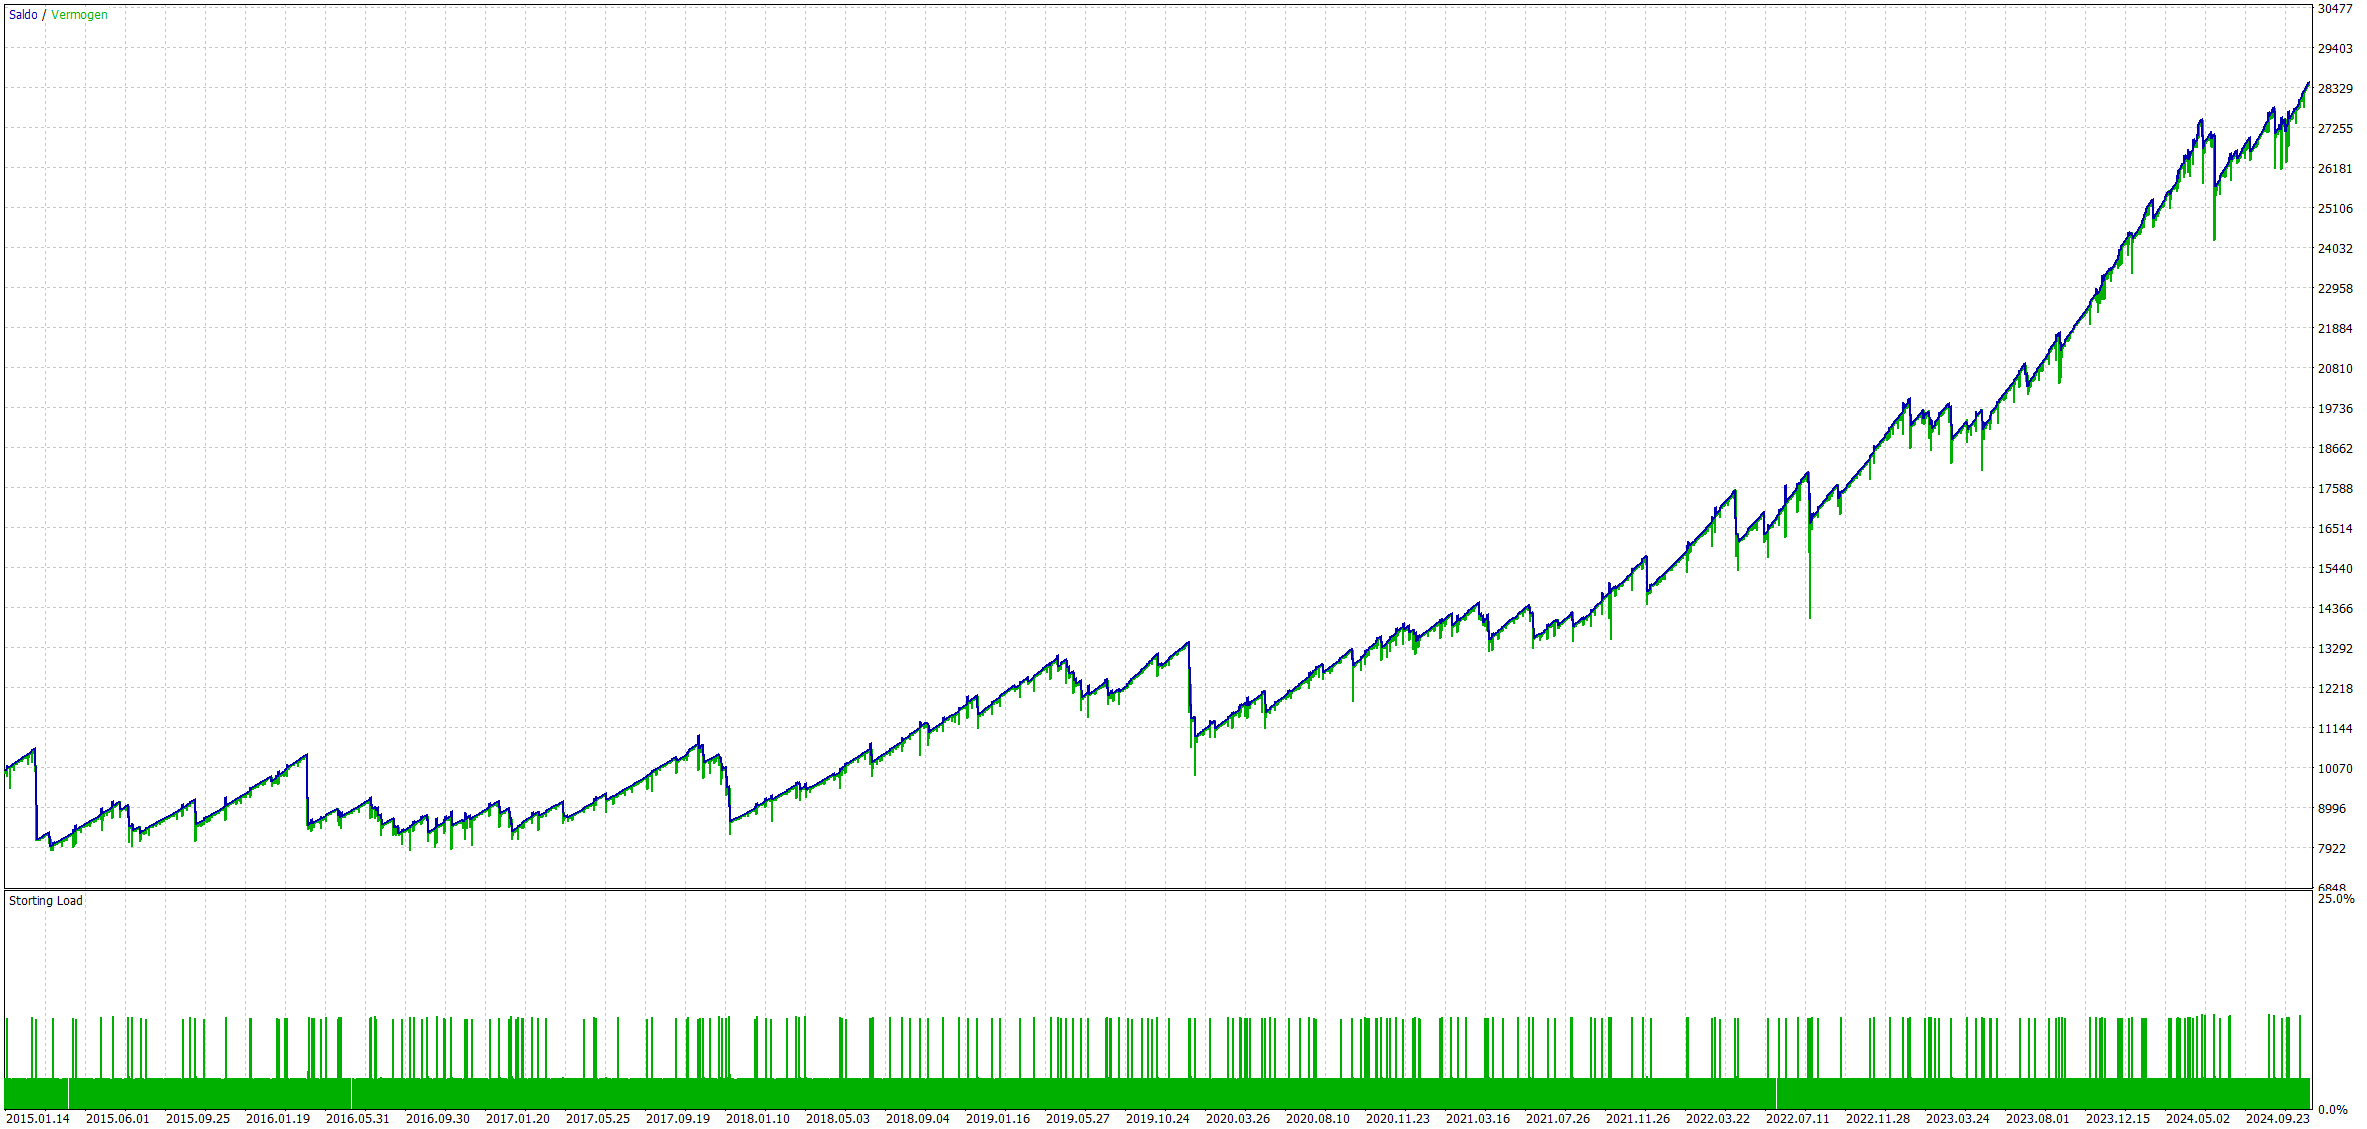
Figure 4. Equity curve and account margin plotted from 1/1/2015 to 1/1/2025 for the boosted results with a max drawdown of 19%.
Running the Strategy Live
Unlike common practice typically observed in algorithmic trading, I did not conduct a traditional out-of-sample test prior to implementing my trading strategy. Instead, I have backtested the strategy across a comprehensive time period of 10 years, during which it has consistently yielded a steady return each year, with an average of over 260 trades executed annually.
Given these favorable results, I made the decision to subsequently test the strategy using a small lot size of 0.01 over the course of the first 6 months, effectively acting as my out-of-sample test. After the conclusion of these 6 months, I will thoroughly review the performance metrics to ensure that the backtesting results align closely with the actual performance observed in the market, thereby allowing me to confirm that this strategy indeed possesses a tangible edge.
Interested to see how my automated trading systems are doing? Check out my trading performance blog by clicking the botton below!